A Decade in Federal Discretionary Spending

Wednesday, December 23, 2020

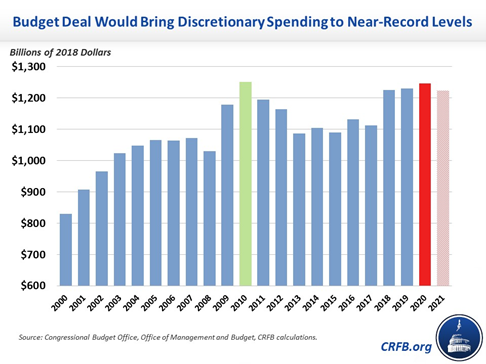
The Government Contracting Industry is a complex marketplace. No other industry is as dependent on the successes and failures of Federal policy, regulation, and Congressional leadership. Our ecosystem lives or dies by it. Elements of the sector ebb and flow depending not only on the needs wants, whims, and votes of American citizens but also the global stage, all of which command our ~$1T competitive landscape pipelined through Federal discretionary spending.

Vendors enter into the fray with dollar signs in their eyes, and at a glance, they’re right to be excited about the potential. But those of us in-the-know understand working with the Federal Government isn’t an opportunity to print money, and what is considered a steady investment still has its ups and downs.

While the World sets its sights on 2021, The Pulse decided to take a step back and examine the state of Federal discretionary spending (procurements and grants) over the last ten (10)…yes 10… years, as we close out the decade not with a whisper – but with a boom.

Federal Discretionary Procurement and Grant Spending

Over the past decade, the Federal government has spent an average of $462B* discretionary dollars on procurement requirements and an average of $573B** on grant-funded priorities, totaling a yearly average of $1T Federal dollars spent on procurement and grant requirements over the past ten (10) fiscal years (FY).

When looking at these numbers, it is important to note that this past decade has seen two (2) of the most significant Government shutdowns in U.S. history as well as an unprecedented global pandemic:

  • A 16-day shutdown in 2013 (FY14) during the Barack Obama administration
  • A 35-day shutdown of 2018 – 2019 (FY19) during the Donald Trump administration, the longest shutdown in U.S. history
  • COVID-19 global pandemic/recession of February 2020 until Present Day (FY20 – FY21)

We’ve also seen at least 21 Continuing Resolutions (CRs) for stopgap spending – which keeps up with an average of 4.6 CRs per FY since 1977.

Each of these factors has created significant disruptions throughout the decade primarily impacting Federal agency funding and reverberating consequences to the Government Contracting Industrial Base and research community.

Following the Great Recession (FY08 – FY10), and after the FY14 government shutdown, the outlook from prognosticators on rising federal procurement spending was murky. But since FY15 we can observe a not-insignificant procurement spending increase. An average of $550B has been spent per FY starting FY16 to Present Day (median $556B) equating to a yearly average increase in total procurement and grant spending of ~$108B…with an additional $28.5B procurement increase in the year of the COVID-10 pandemic (FY20); an almost $225B total increase when procurement and grant spending is combined.

At first glance, it appears that we are increasing procurement spending at the speed of light; but with a new Administration entering the White House in January 2021, the COVID-19 pandemic stimulus struggling, and a new Congress having to face another budget caps dilemma – we now have to question whether spending will stabilize, increase, or drop again.

Federal Product and Service Spending Across Procurements and Grants

When we look at the Product Service Code (PSC) spending data, it is important to remember that these boundary lines are not as clear as we would like them to be. It is almost impossible to break out pure services from development or to determine when bundling service and product requirements have taken place.

On average, the “Services” PSC has maintained a 2% growth rate annually whereas the “Product” PSC has sustained a steady 8%, and “Research & Development” PSC has a -1% growth over the decade. All is not lost for the “Research & Development” PSC as it has seen a significant jump in FY18 to Present Day with an annual growth rate of 7%.

It is important to note that the “Services” PSC has maintained a respectable (but not substantial) lead over product spending over the last ten (10) years, with a steady increase in “Product” PSC spending over the last five (5) FYs as it maintains its 8% growth rate.

One reason why the “Services” PSC holds a steady lead is a massive increase in inherent government function spending from FY17 to Present Day. Due to harmful Federal hiring freezes, damaging leadership vacancies, and steady decreases in funding for internal Federal functions – Government Contractors now perform many duties which most would assume are done by government employees, from managing and overseeing contracts and programs to developing policies and writing regulations.

In the 2012 Senate Committee Hearing on Homeland Security and Governmental Affairs, Claire McCaskill opened with a staggering (but not surprising) statement that “ […] spending on service contractors has outpaced spending on Federal employees. The cost of service contracts has increased by 79 percent over the last 10 years from $181 billion to $324 billion, while in the same time period, spending on Federal employees has only increased by 34 percent, $170 billion to $229 billion.” This was following the September 2011 Office of Management and Budget’s Office of Federal Procurement Policy (OFPP ) final guidance on what constitutes an “inherently governmental function” which had immediate implications for Federal agencies deciding whether to insource work.

This might be the reason we saw a slight decrease across the “Services” PSC starting FY12 and FY13, but the impact was only temporary. It didn’t take long for the “Services” PSC to start to swing back up even though the same issues are still plaguing Federal agencies today.

Federal Agency Spending

Between FY17 and today, discretionary appropriations have increased 30%, from $1.070T to $1.4T – not including the additional $1.76T spent in FY20 for COVID-19 requirements. Defense spending has grown more than 17%, while non-defense has grown more than 15%.

To see how these increases have impacted the Government Contracting Industrial Base, the Pulse analyzed the discretionary procurement spending for 73 Federal agencies for FY10 through FY20. Here are a few fun nuggets of information that we found:

  • The Government Accountability Office (GAO), Export-Import Bank (EXIM), and the Selective Service System (SSS) average a 70% spending increase over the past decade, whereas the Small Business Administration (SBA) averages a staggering 111% increase.
  • Even though the Department of Defense (DOD) continuously sees large increases in Federal appropriations funding, it only averages a 2% spending increase each FY.
  • The Department of Housing and Urban Development (HUD), Environmental Protection Agency (EPA), Department of Interior (DOI), and the Department of Treasury (Treasury) averages a negative percentage when it comes to spending over each FY, with the Office of Personnel Management (OPM) averaging a -10%.

Each of these data points should be taken with a grain of salt and context as different events, leadership, and Congressional priorities impact each Federal agency for better or for worse.

To give you a better understanding of each of these Federal agencies, we have provided an interactive table below for you to search the Top 20 Federal Spenders over the past decade.

Large vs. Small Dollars

When over 44% of the 2020 Fortune 50 companies are competing in the Government Contracting Industrial Base, and the ecosystem is filled with goliath companies with market capitalizations valued in the multi-billions, so it should come as no surprise that 77% of all Federal procurement contracts have been awarded to large businesses.

However, when looking at the total average of growth between large and small obligations, both practically zero out with no real growth on either side. In short, over the past decade, no one group has real gains when it comes to percentages; but when looking at dollar value, that is another story.

But there is one thing concerning us. In FY20, small businesses saw a 0% growth in small business dollars whereas large businesses saw a 7% increase.

Competition

This set of data is for anyone who tells you that if it’s not sole-sourced, it’s not adding to your bottom line. Sure, over the last six (6) years, non-competitive sole-source award values have almost doubled, but as sole sources have increased, so have competing contracts. Each component has increased in line with overall Government spending, and the breakdown of dollars won through competed vs non-competed bids has remained relatively consistent.

We also took a look at some of the most popular Federal procurement vehicles spanning the decade to determine favorites when it came to competing requirements outside of the open market. Here are some of the highlights along with their total Period of Performance (PoP) spending between FY10 – FY20:

  • GSA MAS FSS: $207B
  • GSA IT-70 FSS: $85B
  • Navy SeaPort IDIQ: $57B (includes SeaPort-E and NexGen)
  • NASA SEWP GWAC: $38B (includes IV and V)
  • GSA OASIS GWAC: $30B (includes Unrestricted and Small Business)
  • HHS CIO-SP GWAC: $18B (includes 2 and 3, and Unrestricted and Small Business)
  • GSA Alliant: $15B (includes I and II)
  • VA T4NG IDIQ: $14B
  • DHS EAGLE IDIQ: $13B (includes I and II)
  • GSA 8(a) STARS GWAC: $13B (includes I and II)
  • Army ITES-2S IDIQ: $11B
  • Air Force NETCENTS II IDIQ: $10B
  • Army AMCOM EXPRESS IDIQ: $10B
  • Army Rapid Response IDIQ: $9B (includes CR2, R2-3G, and R2-4G)
  • DISA ENCORE II IDIQ: $8B
  • GSA Networx/EIS GWAC: $6B
  • Treasury TIPSS IDIQ: $6B (includes 3 and 4)
  • DHS FirstSource IDIQ: $6B (includes I and II)
  • GSA VETS GWAC: $2.2B (includes I and II)
  • DHS PACTS IDIQ: $1B (includes I and II)

It is not enough to look at how Federal contracts have competed, we have to look at how those Federal spenders are allocating their money across requirements. In 2019, the Pulse looked at FY19 reported bundled and consolidated dollars to determine how Federal agencies are competing for their requirements. While we didn’t look at the entire decade of this data, what we did find is that 63% of all Federal obligations in FY19 have competed, and about 19% of all actual federal obligations have been to bundled and consolidated requirements, according to strict FPDS definitions (Bundled Class A – G; Consolidated Class A-C).

These numbers mean that the Federal government has been diminishing competition by effectively excluding newcomers (non-traditional) and registered small business (or mid-tier) firms who cannot compete under long-term multiple award contracts (MACs) such as OASIS, CIO-SP3, Alliant, and NASA SEWP – or that can’t meet the standards of a broad range scope of work (SOW).

This data is further substantiated by our socio-economic competition numbers which show that large businesses took home more than 77% of all total obligated dollars over the past decade.

So what factors can attribute to this trend in closed-off competition? There are many, but one we can most certainly point to is Category Management and the subjectiveness of Best-In-Class (BIC) Contract designation.

Contract Types

It would stand to reason that the most popular contract type is the one with the least amount of risk to the seller, so it should be no surprise that Fixed-Price contracts make up 65% of all Federal contracts over the past decade. Cost-Plus contracts make up 30% whereas Time and Materials (T&M) and Labor Hour (LH) make up less than 3%…because the Government believes their requirements are typically well-defined.

When examining the whole picture, we see that Cost Sharing is barely a blip on the radar – BUT it did see a 226% increase from FY18 to FY20, which could be due to the significant increase in Other Transaction (OT) spending.

Other Transaction Authority (OTA) Spending

It’s no surprise that in recent years, OTAs became a GovCon household name for procurement. Although they’ve been around since the ’50s, they historically tried to stay off the radar, until the FY16 National Defense Authorization Act (NDAA) put them back on the map. Then, they became turbocharged after the important clarifications to prototype OTAs addressed by the 2018 NDAA.

This new push permitted the Department of Defense (DoD) agencies to award prototype OTAs as long as it is “directly relevant to enhancing the mission effectiveness of military personnel and the supporting platforms, systems, components, or materials to be acquired or developed by the DoD, or to the improvement of platforms, systems, components, or materials in use by the armed forces.” And spending utilizing this method of procurement hasn’t slowed down since.

As of FY19, OTA’s only accounted for 2% of total Federal obligations. In FY20, they accounted for only 3%. So while OTA’s maybe becoming a more commonly known name, we can see that attention does not always equate to dollars.

However, it is important to note that not all OTA spending is put into FPDS-NG, beta.sam.gov, or USASpending.gov as some are similar to Federal Supply Schedule (FSS) obligations.

Conclusion

So what does all this mean? We have our thoughts and conclusions, but the Committee for Responsible Fiscal Budget (CRFB) says it best: “2010 represented a high water mark for discretionary spending in real dollars. Then, the Budget Control Act of 2011, the major piece of deficit reduction legislation enacted this decade, reduced and capped discretionary spending for ten (10) years. Budget agreements in 2013 and 2015 partially rolled back the sequester and, fortunately, fully offset the cost, but agreements in 2018 and 2019 fully repealed the sequester and increased spending further, largely without offsets. As a result, spending levels are almost back up to 2010 levels after adjusting for inflation. Spending caps are set to end entirely after 2021.”

What it comes down to is today’s discretionary spending levels are high by historical standards. Federal spending is expected to total 21% of Gross Domestic Product (GDP) in FY20, while revenue is projected to total 16.4 percent of GDP.  The GDP is an indicator of a country’s financial health and vitality – meaning the Government Contracting Industrial Base is ~25% of the USA’s economic welfare.

With this decade coming to an end, all we can do is reflect on our past while looking at what the future holds. Even without a global pandemic, multiple contentious shutdowns, and a devastating economic recession, we have the following to look forward to: a debt ceiling suspension expiration, non-negotiable cyber-security regulations for Federal vendors being implemented, the continuing privatization of critical functions that the Federal government is used to handling, the furthering political polarization of Congress, and the aging of the Federal workforce and the painful hiring practices of the U.S. government.

But we’ll discuss that impact in 2030.

More From The Pulse