We are 70 days into Fiscal Year 2020 and the final Fiscal Year 2019 numbers are finally in! As Government Contractors gear up for Q2 of Fiscal Year 2020, The Pulse wanted to take some time to reflect on how Fiscal Year 2019 turned out.
Fiscal Year 2019 started out with more of the same, and the Federal Government finally started running at full steam in February 2019. As we noted in our Government Contracting March Madness: Fiscal Year 2019 Federal Agency Scouting Reports (exclusive to members) – Fiscal Year 2019 had some lucrative aspirations to live up to.
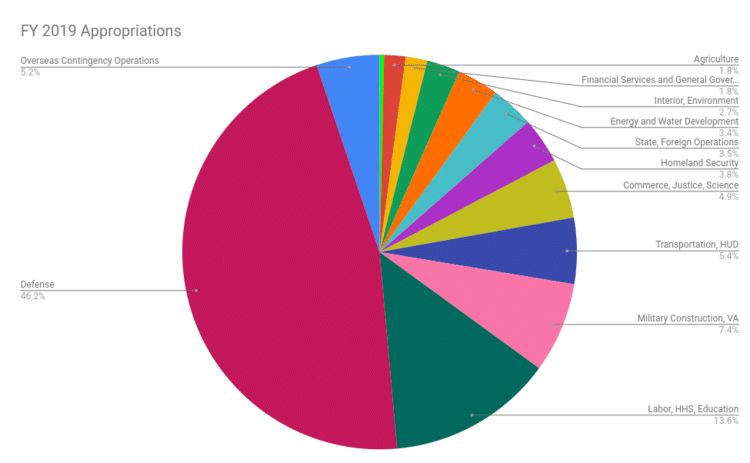
To REFRESH – a total of $1.23T was officially allocated by the 12 Appropriations Committees for Fiscal Year 2019.
Summary of Spending in Fiscal Year 2019
Month-by-Month Breakdown
The Pulse collected the monthly obligations throughout Fiscal Year 2019 and compared it to the past three fiscal years. March 2019 has proved to be the most expensive month of Fiscal Year 2019 for the Federal Government; but when compared to the past fiscal years October through February seems to set new records.
As we can see from our FY19 Superlatives:
-
It was a banner year for Lockheed Martin which dominated the GovCon leader board 9 out of the 12 months in Fiscal Year 2019
-
December 2018 was the busiest month for OTA obligations whereas March 2019, as we stated above, was the busiest month for Federal obligations in general
-
Department of Defense (surprise!) out spent every Federal agency every month of Fiscal Year 2019
OTA Breakdown
OTA’s may be all the rage these days, but in the Fiscal Year 2019, they only accounted for 2% of total federal obligations. It is important to note that not all OTA spending is put into FPDS as some are similar to FSS obligations.
Federal Agency Breakdown
It is not enough to look at who the top Federal spenders are, but how those top Federal spenders are allocating their money across requirements. To do this, The Pulse looked at reported bundled and consolidated dollars reported for Fiscal Year 2019 to determine how Federal agencies are competing their requirements.
For reference, we provided the definitions of what a bundled and a consolidated requirement is:
-
Consolidated Contract – A consolidated contract results when funds are involved and a solicitation is used to obtain offers for a single contract or a multiple award contract to satisfy two or more requirements of a department, agency, or activity for supplies or services that have previously have been provided to, or performed for, that department, agency, or activity under two or more separate contracts.
-
Bundled Contract – Consolidating two or more requirements for supplies or services, previously performed by a small business under separate small contracts, into a solicitation for a single contract (including MACs) that is likely to be unsuitable for award to a small business concern.
According to FPDS, 63% of all federal obligations in Fiscal Year 2019 were competed, and about 19% of all actual federal obligations have been to bundled and consolidated requirements, according to strict FPDS definitions (Bundled Class A – G; Consolidated Class A – C). In order to not conflate or be hyperbolic, The Pulse has displayed the strict definitions data demonstrating total actual obligations across competed, non-competed, and bundled requirements.
However, if you take the total ceiling obligations of these bundled and consolidated requirements, the result is over 82% of total obligations went to bundled and consolidated requirements, according to our calculations.
Our point is that FPDS and agency data collection sources do not currently contain sufficient information to quantify the extent to which bundling of contract requirements takes place, and the total obligations set against them, which leads to incomplete information which heavily impacts small and mid-tier businesses. This is further explained by a recent report put out by the Small Business Administration (SBA) where the SBA only received two reports from Federal Agencies regarding their bundling activities in Fiscal Year 2017.
So what does this mean?
Whether it is 19% or 82% – these numbers mean that the Federal Government has been diminishing competition by effectively excluding new comers (non-traditionals) and registered small business (or mid-tier) firms who cannot compete under long-term multiple award contracts (MACs) such as OASIS, CIO-SP3, Alliant and NASA SEWP – or that can’t meet the standards of a broad range scope of work (SOW). This data is further substantiated by our socio-economic competition numbers cited below which shows that Large Businesses in Fiscal Year 2019 took home more than 71% of all total obligated dollars.
So what can factors can attribute to this trend in closed off competition? There are many, but one we can most certainly point to is Category Management and the subjectiveness of Best-In-Class (BIC) Contract designation. According to the Fiscal Year 2019 Presidential Management Agency, Federal Agencies were held accountable for funneling 37% of “BIC-addressable” spending through BIC contracts. This may have seemed like a lofty goal to those that weren’t paying attention, but the Federal Government made substantial progress in Fiscal Year 2018 and now it seems in Fiscal Year 2019.
Top Government Contracting Vendors
For the sake of time, The Pulse just pulled the Top 200 beneficiaries of Fiscal Year 2019 federal obligations so far. For the full list, click here.
Socio-Economic Spending
What about socio-economic spending? In Fiscal Year 2019, Large Businesses have seen 71% of the total federal dollars, whereas Small Businesses have only seen 22%. There are several reason we can attribute for this, including 82% of all federal dollars going to consolidated and bundled requirements as we cited above.
The Large Business number shouldn’t surprise anyone in Government Contracting, but when looked at through the scope of consolidation and competition, red flags should be waving fervently. Consolidation and the unintended consequences of Category Management for businesses of all sizes impact the critical elements that sustain Government Contracting – competition, innovation, and economic stimulus.
For a full breakdown of Fiscal Year 2019 socio-economic obligations by Federal Agency, click here.
NAICS and PSC Breakdown
The favorite NAICS of Fiscal Year 2019 was for – surprise – materials. NAICS 33 represents requirements for metals, machinery, computer, electronics, electrical transportation equipment, and furniture, and made up 32% of total federal obligations to date.
With 17% of total obligations, the favorite PSC of Fiscal Year 2019 has been 1 (Products) – shocking.
Summary of Q4 Spending in Fiscal Year 2019
Percentage of total fiscal year OBLIGATIONS & q4 fiscal year obligations
Federal Government Q4 spending accounted for 24% of all total Fiscal Year 2019 obligations. As we covered in our Q4 Federal Spending Statistics article – we found that FY14 through FY18 averaged obligating around 68% of their GovCon-specific discretionary funding prior to the start of Q4. Leaving at least an average 30% of all fiscal year funds available to GovCons for the Q4 sprint.
Q4 Fiscal year 2019 buying trends
Competition Type and Procurement Tactics
The Pulse analyzed single vehicle awards, multiple vehicle awards, purchase card spend, and OTA obligations to understand how the Federal Government is buying. In Q4 Fiscal Year 2019, the Federal Government trended in almost the same direction as its previous years with single awards in the lead.
NAICS and PSC Breakdown
In Q4 of Fiscal Year 2019, the Federal Government spent 40% of their total Q4 obligations on professional, scientific and technical services (NAICS 54). As we covered in our Q4 Federal Spending Statistics article – this is inline with typical Q4 spending trends.
In total, the Federal Government spent at least $40B on products versus $79B on services (to include research and development) in Q4 of Fiscal Year 2019. As we covered in our Q4 Federal Spending Statistics article – this is inline with typical Q4 spending trends with PSC R winning out over its colleagues.
Moral of the Story
A lot of industry consultants and publications are starting to release their trends and predictions for Fiscal Year 2020 concepts – and they do this with limited or unsubstantiated data. The Pulse wants you to be informed, and to take some of the click-bait you see with a grain of salt. When you have the full picture, you are better equipped to see the forest for the trees, and align your strategy to where you fit. Armed with some proper planning, an understanding of the past Fiscal Year trends, and little research – you can begin to get your Fiscal Year 2020 pipeline into shape!
*A note on FPDS.gov: The Federal Procurement Data System—Next Generation (FPDS)—is a central database of U.S. government-wide procurement. FPDS generally reports information on contracts that exceed the micro-purchase threshold, defined in 48 C.F.R. §2.101. 3 The micro-purchase threshold is generally $10,000 (meaning that contract actions above this amount must be reported to FPDS). FPDS does not include data from judicial branch agencies, the legislative branch, certain DOD components, or select executive branch agencies—such as the Central Intelligence Agency and National Security Agency. Unless otherwise indicated, all data in this report are derived from FPDS. Decision makers should be cautious when using obligation data from FPDS to develop policy or otherwise draw conclusions. In some instances, a query for particular data may return differing results, depending on the parameters and timing.